Height & height profiles
Height & height profiles on RouteYou

Since height and deviations in height is an important piece of information when you do out-door sports and activities, it is being used at several points on the RouteYou site.
Here is an overview
- Height on the route profile
- Height to calculate the route statistics
- Height in the GPX file to download on your GPS
Where does RouteYou gets its height from

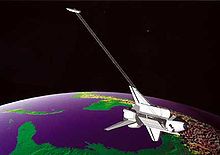
The source of the height information is SRTM data (or height data derived form the Shuttle Radar Topography Mission).
This project from NASA in the year 2000 provided a digital elevation model of the Earth.
But, as with any source, it has some problems. Sometimes it has some missing data or other strange bleeps. RouteYou cleaned that up to get better results.
Also in the calculation of the statistics based on height, we take into account the noise of the data. Read the part on "Why is it that the height differences (total ascent) is relatively higher than measured with other methods (e.g. GPS)?".
Strange things with height
Why are there differences in height
Define height...
One would think that height should be a straightforward thing to define. But quite some scientific battles were fought about this.
Let's start from the simple concept: "Height is a measure from the distance to the centre of the earth (minus an off-set if you like)."
That would work fine, except, it was hard to measure this before there was GPS and the Earth is not a sphere. It's not even an ellipsoid. It's a geoid. Something like a patato, although a very smooth one and quite looking like a sphere from a distance.
So topographers in the past took a practical measure. Let's start measuring from the sea level. Again: which sea level? What about the tides? The sea level moves up and down (even without climate change). Topographers in the past couldn't agree on which level of the sea to take. Do we take the average low water tide, the average tides overall, the average springs,...
So every country had its own reference, or they remeasured it (so we are stuck with references such as NAP, TAW, NN, ..). A funny result is the "famous Belgian-Netherland threshold in height". If you take the official heights of the border of the Netherlands and Belgium, there is a few meters of difference. So if you would believe the topographical maps from these two countries, you have to take a step down when entering the Netherlands from Belgium.
When the GPS came, things improved, because we could have a world wide reference system (included in the geoid calcualted from WGS 84). But still, this type of measurements are difficult to change. So that's why you might find a few meters difference depending on your reference. And ofcourse, there are always the inaccuracies.
What do you measure...
How difficult can that be? The ground of course. But a lot of techniques, such as RADAR measure the surface form which the signal reflects. So it includes buildings. And brdiges. Also dense vegetation has an infuence,... Especially in cities, you might have quite some 'noise'.
Inaccuracies and errors in height
Every measure has an error. So it is also with height, even if everybody agrees in the same reference.

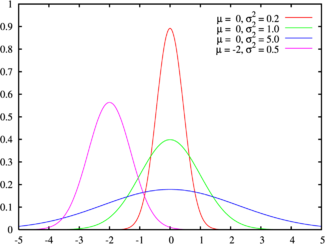
A good way to visualise the error is the following: Just imagine that from every exact spot, you know the exact height. Now you measure the difference of that height with what you measured in the real world. Sometimes you will be above or sometimes below your "exact height". Make sticks of these height-difference. Red ones if negative (if lower than the exact height), and green ones if positive. Put them in buckets if they are the same length and count each bucket. You will see that most of the sticks are in the bucket <5m. A bit less in >5m and <10m. A bit less in the bucket >10m but <15m ... There will not be many, but you might find a few sticks which are >50m.
To get an idea, it is estimated that 66% of all your sticks will be <15m if you would do this for the SRTM model.
To be able to express that bunch of sticks in one number, one came up with a measure called RMSE or "Root Mean Square Error". There are plenty other methods, but they are similare to the this principle. For those interested in the exact measure, check this out on Wikipedia.
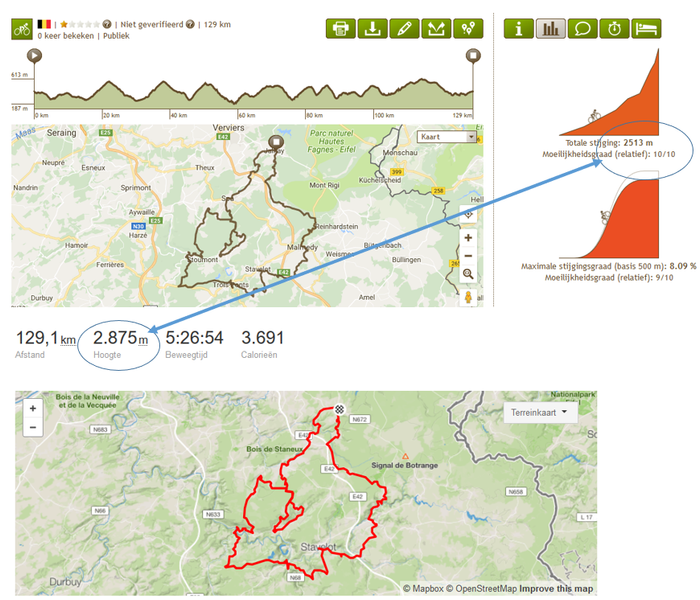
Difference between height measurements on RouteYou, Strava, Garmin,...
You will notice that the same route on RouteYou and on other platforms has different results about the height (see figure below).

This is due to choices made on noise filtering and other type of corrections made during the process.