Elevation data and accuracy
Table of contents
- The usefulness of elevation data
- How does RouteYou calculate elevation data?
- Where can things go wrong?
- Rough terrain
- Altimeters calculated by a GPS device
- Interesting links
The usefulness of elevation data
Elevation data along a route contain important contextual information about your route. So do derivatives such as climb meters or average percentages.
They form the story of your route: the number of altimeters, for example, determines the physical effort and thus, indirectly, the target audience of a route. However, it remains difficult to correctly calculate elevation profiles, ascent meters and gradients along routes or route segments. Exactly what constitutes a realistic number of ascent meters often proves open to interpretation. Depending on the source, e.g. barometric altimeters or public commercial elevation models (e.g. SRTM), recorded values can vary widely. Although highly detailed elevation models (LIDAR) are already available, they typically remain expensive and only locally available.
How does RouteYou calculate elevation data?
Today, we use the SRTM elevation model. SRTM has a resolution of 90m. In some areas such aas Flanders, we have more detailed information available.
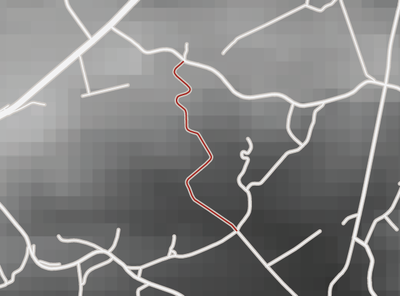
What does this mean? Take a look at the example below on the well-known slope in the Flemish Ardennes "La Houppe":
The gray values represent the registered height value in the SRTM height model: the lighter the higher. So you can clearly see that "La Houppe" is a slope. The resolution is the size of a cell with a given height and thus gray value. This resolution also immediately determines the accuracy with which we can determine elevation data along this climb, and by extension any route on RouteYou.
Elevation profile of La Houppe:
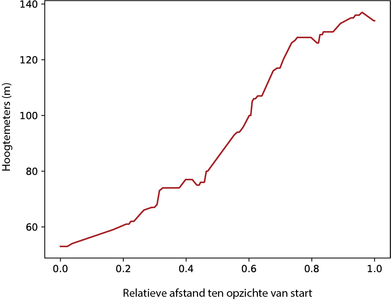
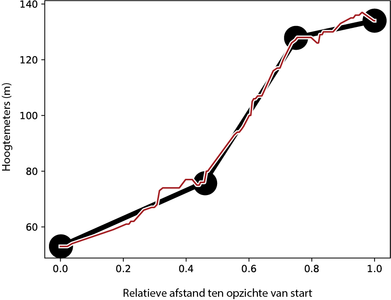
The result is a hilly elevation profile that does not fully reflect reality. If we use these elevations to calculate, for example, the total number of ascent meters or the maximum rate of climb along the slope, it results in an overestimate. Therefore, we use algorithms to determine the significant "kink points" on a segment. These nodal points are shown as black spheres in the graph below. Based on the kinks, we calculate altimeters and derivatives.
Where can things go wrong?
To interpret why altimeters are often open to interpretation, we need to look at certain things in more detail.
What is a Digital Surface Model?
The image below illustrates an initial problem that can crop up with the SRTM elevation model we use.
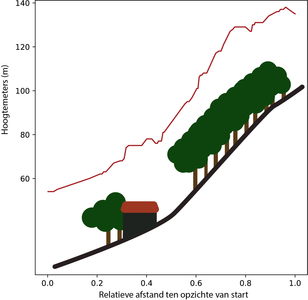
The SRTM model is a Digital Surface Model (DSM): the elevation measurements do NOT follow the terrain, but rather WELL follow the observed elevation from a top view. In other words, you measure, for example, the height of the crowns of trees or the roof of a house. This explains why the height profile of La Houppe looks like this and where the noise in the height data comes from. Especially on longer routes, this noise can generate altimeters that should not be overcome.
Rough terrain
Rough terrain can also cause the elevation in a particular cell to not be representative of the elevation of the road you are cycling on. For example, consider a road along a river in a valley or a road on the flank of a mountain. The image below gives an example of the different elements that can be contained in one cell.
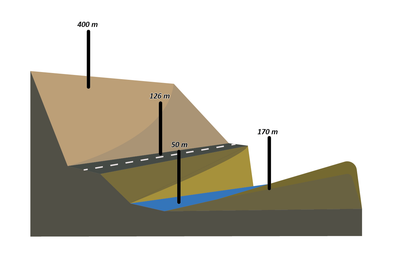
In this cell you measure the elevation on the western flank, on the road, on the river and on the eastern flank. You can imagine that such dispersion in altitude values within a single cell also introduce noise into altitude measurements.
Altimeters calculated by a GPS device
Often cyclists consider the altimeters calculated by their GPS device as the "real" ascent meters. However, even there things can go wrong. We need to distinguish between a GPS with a barometric altimeter and one without.
Barometric altimeter
Barometric altimetry relies on the principle that air pressure decreases with altitude. Altitude is measured based on a formula that indicates the relationship between the two. At low altitude, a drop of one hPa corresponds to 8.5 meters. In terms of accuracy, we must distinguish between relative and absolute accuracy in this type of measurement.
Relative accuracy depends on the sensitivity of the barometric sensor. Each sensor has a different accuracy in detecting pressure and therefore altitude differences. With a properly calibrated Garmin Edge 1000, this will be around 3 meters. However, we must keep in mind that wind, temperature and even shock can have an impact on these barometric sensors. Dirt can also adversely affect the accuracy of the sensor. For example, the opening of the sensor being covered by water or mud.
The absolute accuracy of a barometric altitude measurement is more complex. To convert an air pressure to an altitude, a reference altitude is needed. The standard air pressure at sea level (0 m) could be used (1013.25 hPa), but this can cause gross errors. In stable weather conditions, for example, the sea level air pressure can reach 1040 hPa. So a calibration step is needed. During calibration, most GPS devices are going to associate the initial pressure reading with an altitude measured by the GPS signal. If a device cannot calibrate long enough or calibration must be done in an area with poor GPS reception, again this can lead to errors in the altitude measurements.
Altitude measurement with GPS signal
If your device does not have a barometric sensor, then it will calculate based on the GPS signal. So in addition to your position in latitude and longitude (or x and y) in a flat plane, you will also determine the z-value based on this signal. Depending on the quality of your GPS signal, significant errors can be registered. Consider, for example, poor GPS reception in forests or densely built-up areas. So indirectly, this also has a very strong impact on the quality of your device's calculated altimeters.
Interesting links
The RouteYou height profile
Click here for more information.
Academic research
RouteYou also participates in academic research to improve altitude data. In 2017, Lennert Teugels, a Master student of the Department of Geography, conducted research on optimizations of an altitude model. You can read his account at the following link:
Thesis Lennert Teugels: https://lib.ugent.be/fulltxt/RUG01/002/349/841/RUG01-002349841_2017_0001_AC.pdf
Webinar
 During this EN-language webinar, an explanation of the problem of height measurements was given.